Principal Component Analysis
 Figure 1: Principal component analysis of shape data.
Principal component analysis of sample shape coordinate data for Hiscobeccus capax revealed a pattern of morphological variation associated with the anterior-posterior length (a proxy for stage in ontogeny) of each specimen (Figure 1). In particular, the distribution of specimens along PCA axis 1, which explains 83% of the total variation in the shape coordinate sample, forms a gradient arranged according to the anterior-posterior length of each respective specimen (Figure 1). This result demonstrates that much of the variation in shell shape (as defined by the 11 landmarks examined in this study) within the sample is based on the relative size, or stage in ontogeny, of the specimens comprising the sample. This result demonstrates a pattern of allometric growth in H. capax, that is, a pattern of growth in which the shape of the organism changes throughout its life history.
Principal component analysis is a useful technique for interpreting shape coordinate data because PCA axis loadings can be used to assess what specific shape coordinates from a larger set of anatomical landmarks contribute most strongly to variation (that is, drive shape variation) within a sample. For this study, shape coordinates with PCA axis 1 loadings of greater than 15% were chosen to further examine shape variation in H. capax (Table 1). The 15% cutoff was chosen arbitrarily, and is simply based on the range of axis loadings resulting from principal component analysis of the sample data. Specifically, shape coordinates with 15% or higher PCA axis 1 loadings comprise 1/3 of the total shape coordinate data (11 of 33 total coordinates) for each individual specimen.
Principal component analysis is a useful technique for interpreting shape coordinate data because PCA axis loadings can be used to assess what specific shape coordinates from a larger set of anatomical landmarks contribute most strongly to variation (that is, drive shape variation) within a sample. For this study, shape coordinates with PCA axis 1 loadings of greater than 15% were chosen to further examine shape variation in H. capax (Table 1). The 15% cutoff was chosen arbitrarily, and is simply based on the range of axis loadings resulting from principal component analysis of the sample data. Specifically, shape coordinates with 15% or higher PCA axis 1 loadings comprise 1/3 of the total shape coordinate data (11 of 33 total coordinates) for each individual specimen.
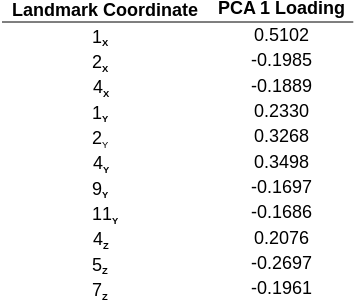
Table 1: Shape coordinates with > 15% PCA axis 1 loadings.
Shape Trends
Plotting landmarks with corresponding shape coordinates having 15% or higher PCA axis 1 loadings (Figure 2) shows overall morphological changes in H. capax in more detail, and provides a visual depiction of what shape changes drive morphological variation in the taxon.

Figure 2: Landmarks with shape coordinates having 15% or higher PCA axis 1 loadings.
Figures 3-5, shown below, depict landmark constellations for shape coordinates having 15% or higher PCA axis 1 loadings in the x, y, and z shape dimensions, respectively. The main ontogenetic shape trend occurring in the x shape dimension (Figure 3) appears to be the posterior deflection of landmark 1 (corresponding to the point of attachment of the shell to the seafloor) in association with the downward deflection (parallel to the z shape axis) of landmarks 2 and 4 (corresponding to the "deepest" section of the medial anterior sulcus).
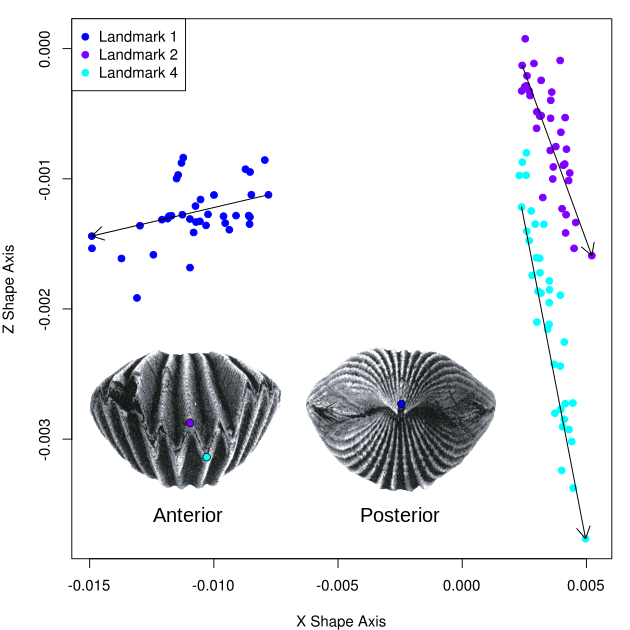
Figure 3: Landmarks having corresponding X shape coordinates with 15% or higher PCA axis 1 loadings. Plotted arrows connect smallest (tail of arrow) and largest (tip of arrow) specimens in the sample, showing the ontogenetic shape change trend.
Downward deflection of the sulcus (landmarks 2 and 4) and outward deflection of the lateral shell commissure (landmarks 9 and 11) appear to constitute the main ontogenetic shape changes occurring in the y shape dimension (Figure 4). A growth trend demonstrating outward displacement of the lateral shell commissure and downward displacement of the medial anterior sulcus corresponds to a growth pattern in which the shell becomes more globose, or spherical, as it grows larger, thereby differentiating parts of the shell gape, and potentially changing patterns of passive flow, throughout ontogeny.
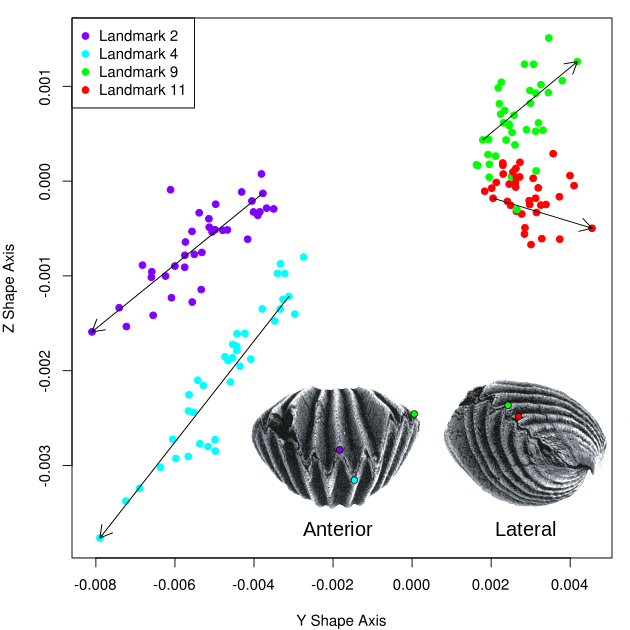
Figure 4: Landmarks having corresponding Y shape coordinates with 15% or higher PCA axis 1 loadings. Plotted arrows connect smallest (tail of arrow) and largest (tip of arrow) specimens in the sample, showing the ontogenetic shape change trend.
Vertical deflection of the anterior-most sections of the lateral shell commissure (landmarks 5 and 7) away from the downward deflection of the medial anterior sulcus appears to constitute the main ontogenetic shape change occurring in the z shape dimension (Figure 5). This trend further demonstrates the differentiation of the sulcus from the rest of the shell commissure that occurs throughout the ontogeny of H. capax.
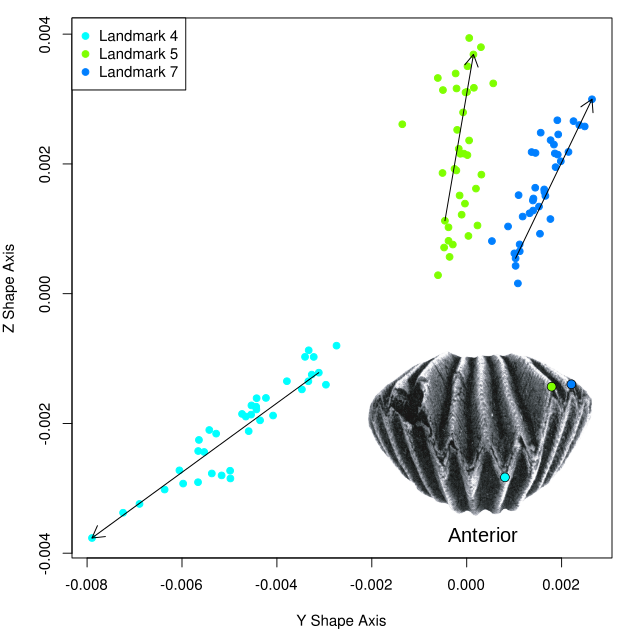
Figure 5: Landmarks having corresponding Z shape coordinates with 15% or higher PCA axis 1 loadings. Plotted arrows connect smallest (tail of arrow) and largest (tip of arrow) specimens in the sample, showing the ontogenetic shape change trend.
Generally speaking, the allometric growth trend shown by H. capax can be summarized in terms of the shell becoming more globose, or spherical, as the organism becomes larger (that is, as the shell attains a greater anterior-posterior length). This trend is visualized in an intuitive manner by plotting the z shape coordinate of landmark 5 as a function of the anterior-posterior length of each specimen (Figure 6). The growth curve demonstrated in Figure 6 shows the progressive and non-linear (that is, entailing a change in shape) displacement of the lateral sections of the shell from the developing sulcus as H. capax increases in size and changes in shape.
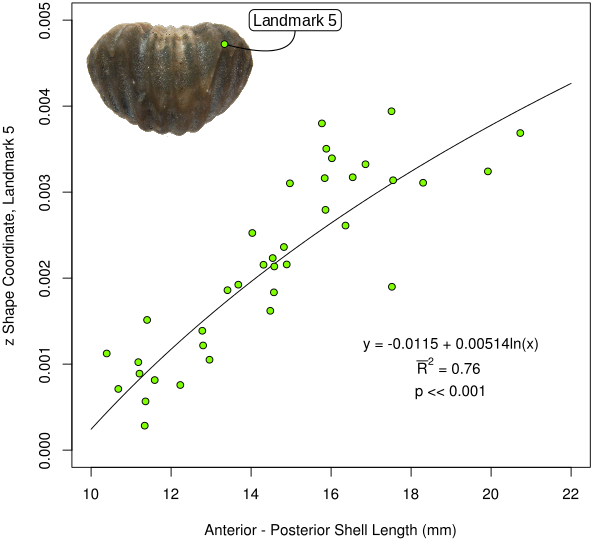
Figure 6: Allometric, logarithmic growth trend. A non-linear, logarithmic regression produces a higher coefficient of determination than a simple linear regression.
Patterns of Passive Flow
Passive flow was observed in all three models of H. capax when oriented with the medial anterior sulcus of the shell perpendicular to the direction of oncoming fluid flow (Figure 7). Flow was not induced through any of the models when oriented with the medial anterior sulcus facing directly upstream or downstream. Whereas flow passed directly through the smallest model, inhaled from the upstream lateral gape and exhaled through the downstream lateral gape, the intermediately-sized and large model were observed to divert exhalant flow through both the downstream lateral gape and medial anterior sulcus (Figure 7).

Figure 7: Patterns of passive flow observed in flume experiments (models shown in plan view). Corresponding specimens shown for largest and smallest models (magnification is identical for both fossils). Black arrows indicate direction of 6 cm/s unidirectional fluid flow.
Changes in shell morphology and concomitant differences in passive flow that occur throughout the ontogeny of H. capax are most likely related to changes in feeding organ (lophophore) morphology that occur throughout the ontogeny of extant rhynchonellide brachiopods (Figure 8). Living rhynchonellide brachiopods have a complex, three-dimensional spirolophous lophophore in the adult stage of development (Rudwick, 1970). Adult examples of modern genera such as Notosaria show laterally-inhalant and medially-inhalant active feeding currents (Figure 8; lophophore tentacles shown in cross-section for reference), a pattern of flow analogous to that observed here in the case of H. capax. Assuming that lophophore ontogeny in living rhynchonellides is a suitable analogue for H. capax, the changes in passive flow observed in this study most likely correspond to an ontogenetic history tracking the development of a complex, three-dimensional lophophore from an essentially flat, two-dimensional structure (trocholophe or schizolophe). In the case of smaller (juvenile) examples of H. capax, passive flow and entrained food particles could likely pass directly across the two-dimensional lophophore, with filtered water (lacking food) and feces being exhaled downstream of the animal's inhalant opening. In larger (adult) H. capax, however, passive flow and food particles likely passed across and through the more complex three-dimensional lophophore, calling for a second exhalant flow opening - a function apparently served by the medial anterior sulcus. Both arrangements would allow the animal to separate inhalant (food-bearing) and exhalant (filtered, excreta-bearing) flows via discrete openings in the shell gape.

Figure 8: Passive flow patterns observed in flume experiments and approximately corresponding positions of specimens and models along a generalized ontogenetic pathway for dorsally-disposed spirolophous brachiopod lophophores [2].
